

Contact
Us
Archers Company L.L.C.
7527 NE 33rd Dr.,
Portland, OR, 97211
Phone (503) 249-8870
Fax (503) 249-8296
www.archerscompany.com
|
Anti-Vibration Handlebars 
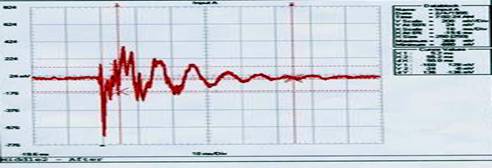
To demonstrate/refute the value of the Hav-Not we devised a test that would measure the actual motion at the bar. We did this by connecting an inductor to the end of the bar then striking the bar with a pendulum mounted mallet. The output from the inductor was input to an oscilloscope for interpretation. Far End Test Without Hav-Not Data Block Cursor Values Name = Input A X1: 9.6 ms Date = 1/21/1995 X2: 109.6 ms Time = 8:29:16 PM dX: 100.0 ms Y Scale = 500 mV/Div Y1: 0.80 1.24 V Y at 50% = 0.00 V Y2: 0.00 0.06 V X Scale = 20 ms/Div dY: -0.80 -1.18 V X At 0% = -40.0 ms X Size = 250 (250) Maximum = 1.24 V Minimum = -2.02 V
Data Block					Cursor Values
Name     =  Input A				X1:    10.4 ms
Date     =  2/4/1995				X2:   110.4 ms
Time 	   =  7:00:30 AM			dX:   100.0 ms
Y Scale  =  500 mV/Div				Y1:     0.32   0.74 V
Y at 50% =    0.06 V				Y2:    -0.02   0.02 V
X Scale  =   20 ms/Div				dY:    -0.34  -0.72 V
X At 0%  =  -39.2 ms
X Size   =  250 (250)
Maximum  =    1.06 V
Minimum  =   -1.00 V
This first test (shown above), called, "Far End", shows how energy is transmitted from one end of the bar to the other. The bars were struck at their end, with a pendulum mounted mallet; the effect of the mallet strike was measured at the opposite end of the bar. Motion is noticeably reduced, by nearly 40%, in frequency (how quickly the bars vibrate), amplitude (how much or how far they vibrate) and duration (how long they vibrate). Middle Test Before Hav-Not Data Block Cursor Values Name = Input A X1: 4.8 ms Date = 1/21/1995 X2: 54.8 ms Time = 8:37:57 AM dX: 50.0 ms Y Scale = 200 mV/Div Y1: -128 376 mV Y at 50% = -176 mV Y2: -16 16 mV X Scale = 10 ms/Div dY: 112 -360 mV X At 0% = -20.0 ms X Size = 250 (250) Maximum = 488 mV Minimum = -904 mV
Data Block					Cursor Values
Name     =  Input A				X1:    5.2 ms
Date     =  2/4/1995				X2:   55.2 ms
Time 	   =  7:02:05 AM			dX:   50.0 ms
Y Scale  =  200  mV/Div				Y1:  -216   104 mV
Y at 50% =   24   mV				Y2:   -24    -8 mV
X Scale  =   10   ms/Div			dY:   192  -112 mV
X At 0%  =  -19.6 ms
X Size   =  250 (250)
Maximum  =  408   mV
Minimum  = -712   mV
Note: For more information and documentation regarding the testing and test procedures please e-mail me and I’d be happy to respond. My thanks to: Eddie Cole for their help and enthusiasm.
| ||


